The State of Data Center Development in the US
425,032 regulatory records. 607,522 authority decisions. 1,441 projects. The data tells a story that contradicts almost everything you think you know.
Data provided by Spark AI
The Indiana Anomaly
Indiana has approved 63 data center projects — nearly 3x more than Virginia (22), the state synonymous with "Data Center Alley" for two decades.
Indiana alone accounts for 42.9% of all approvals in the dataset. With a 96.9% approval rate (63 approvals vs. just 1 rejection and 1 moratorium), the state has made itself the path of least resistance for hyperscalers.
But this is triggering a backlash: a nearly 700-page bill (HB 1210) was passed in February 2026, and by 2035, AI data centers are expected to add electricity demand equivalent to building a second Indianapolis and a second Fort Wayne.

Indiana: America's quiet data center superpower.
Data Center Approvals by State
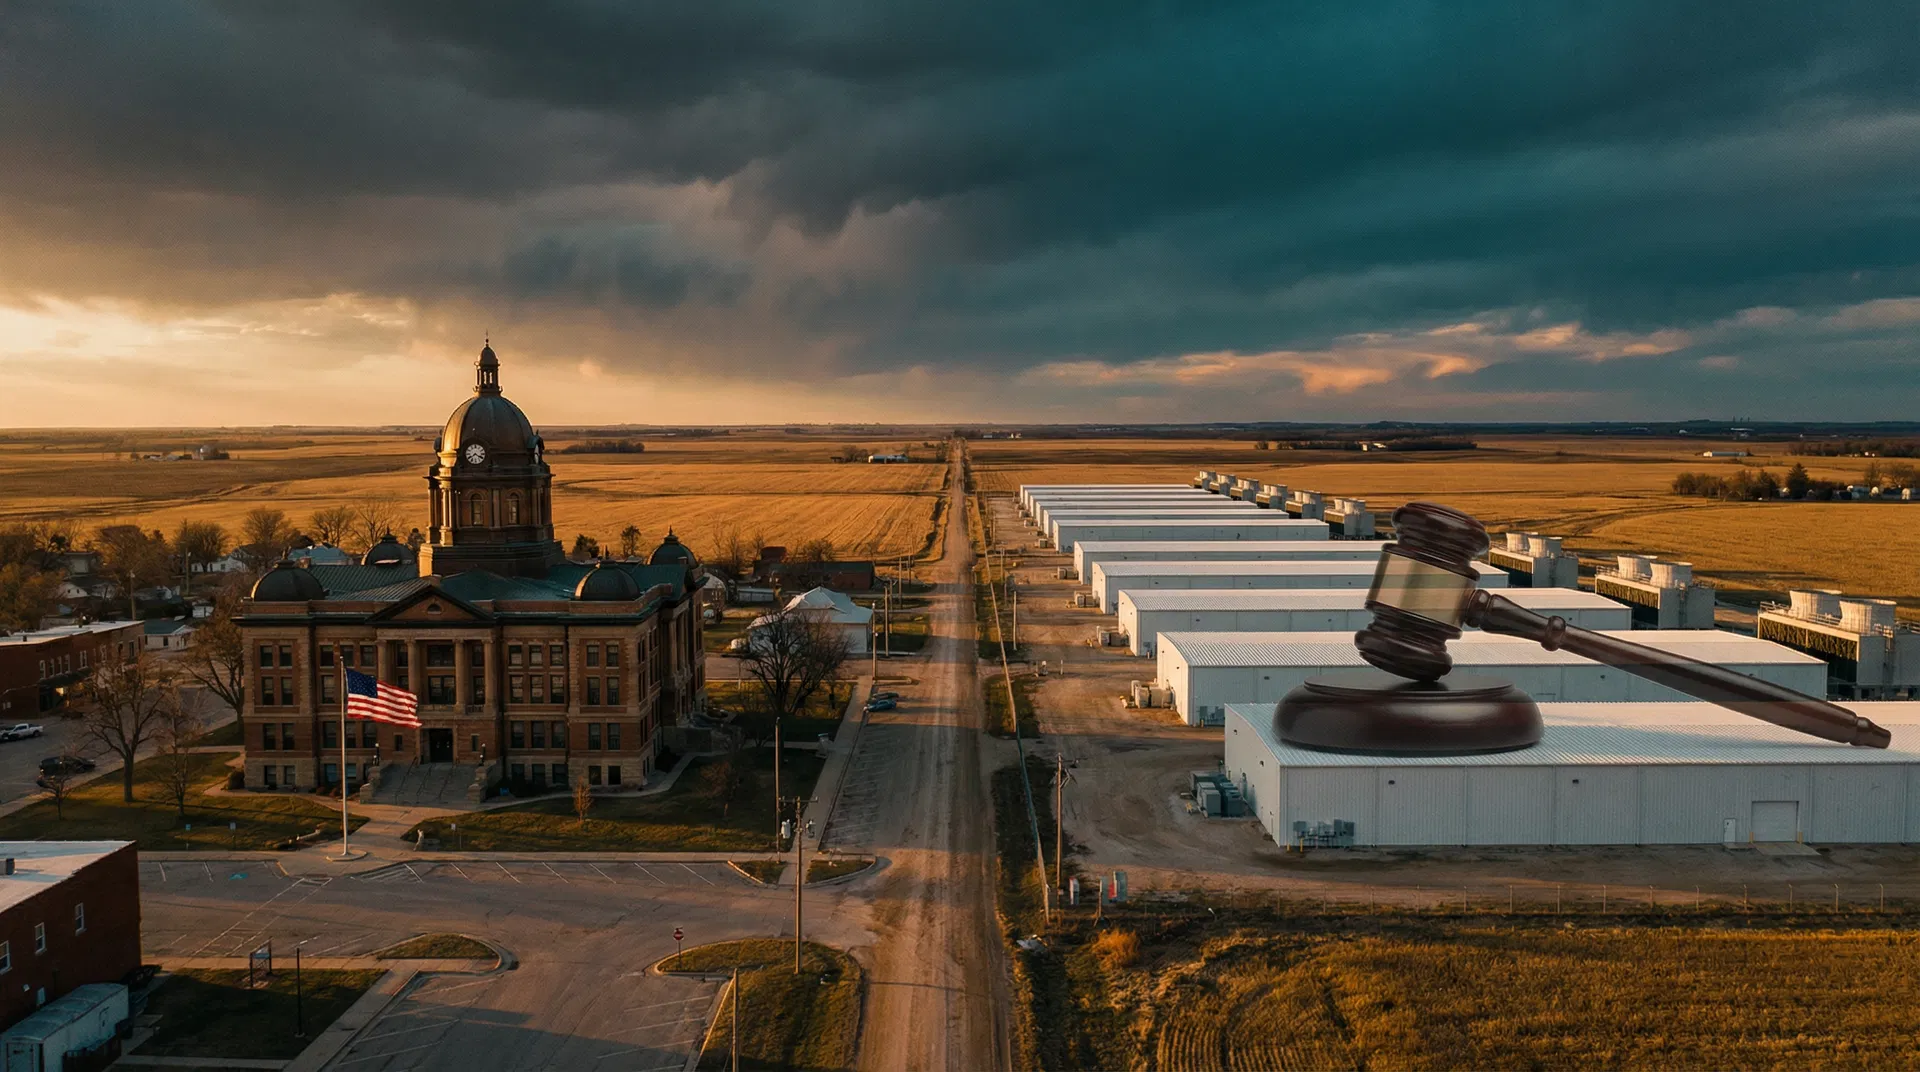
"Is Indiana trading its agricultural identity for a future as America's server farm — and will it regret the speed at which it said yes?"
The Great Midwest Takeover
The Midwest: 75% of approvals and counting.
Midwest states account for 74.8% of all data center approvals. The traditional Southeast corridor? Just 25.2%.
When people think "data centers," they think Northern Virginia, Atlanta, or Dallas. Nobody thinks "corn belt." Yet the data tells a completely different story about where the next generation of capacity is actually being built.
Virginia's grid is straining — Dominion Energy's data center demand hit 3,583 MW in 2024, nearly 7x the 2013 level. The Midwest's manufacturing decline left communities eager for any economic development.
Midwest vs. Southeast: Share of Approvals
"Are we witnessing the birth of a new 'Data Center Belt' across the American heartland — and will it follow the same boom-and-bust trajectory as the old Rust Belt?"
The 94% Rubber Stamp
Across all states, 94.2% of data center projects are approved. Only 3.2% are rejected and 2.6% face moratoriums. Out of 607,522 total authority decisions, only 35 resulted in rejection or moratorium.
The public narrative is dominated by stories of community opposition and cancelled projects. Heatmap reported 25 data centers were cancelled in 2025 due to local pushback — 4x the number in 2024. But these high-profile rejections are statistical outliers. The vast majority sail through with minimal friction.
"If 94% of projects get approved regardless of opposition, is the regulatory process actually serving as a check on development — or is it performative democracy?"
The 422-Decision Gauntlet
Each data center project generates an average of ~295 regulatory records and requires navigating ~422 separate authority decisions.
Most people assume data centers get a simple "yes" or "no." In reality, each project must navigate hundreds of individual decisions — zoning variances, environmental permits, utility agreements, tax abatements, water permits, building permits, and more.
This complexity is a competitive moat for well-resourced hyperscalers. A company like Meta (with 394 projects and armies of lawyers) can navigate 422 decisions systematically. A smaller competitor or a community trying to oppose a project faces the same labyrinth with a fraction of the resources.
"Is the regulatory process designed to protect communities, or has it become a filtering mechanism that only the biggest corporations can afford to navigate?"
Oracle's 11.8% Conversion Crisis
Oracle has a 11.8% project conversion rate — for roughly every 100 projects it files, only about 12 make it through. Meanwhile, Meta has 394 projects (27.3% of all tracked), suggesting a significantly higher conversion rate.
Oracle's low conversion rate likely reflects a "spray and pray" strategy — filing in many jurisdictions simultaneously. This is consistent with reports of delayed OpenAI data centers and a major financial backer (Blue Owl Capital) pulling out of a $10 billion deal.
"Is Oracle's low conversion rate a sign of strategic overreach, or the canary in the coal mine for an industry filing more projects than it can actually build?"
The Only States That Said "No"
Wisconsin (0 approvals, 2 rejections) and Utah (0 approvals, 1 rejection, 1 moratorium) are the only states with zero approvals and active rejections.
In a landscape where 94% of projects get approved, these two states represent genuine anomalies — places where the default answer is "no." This is not some projects passing and some failing. It's a categorical rejection of the entire industry.
Microsoft was rejected in Caledonia after 40 of 49 public speakers opposed the project. Google scrapped a 470-acre Indiana site after protest signs appeared. Democratic lawmakers proposed a statewide moratorium in February 2026.
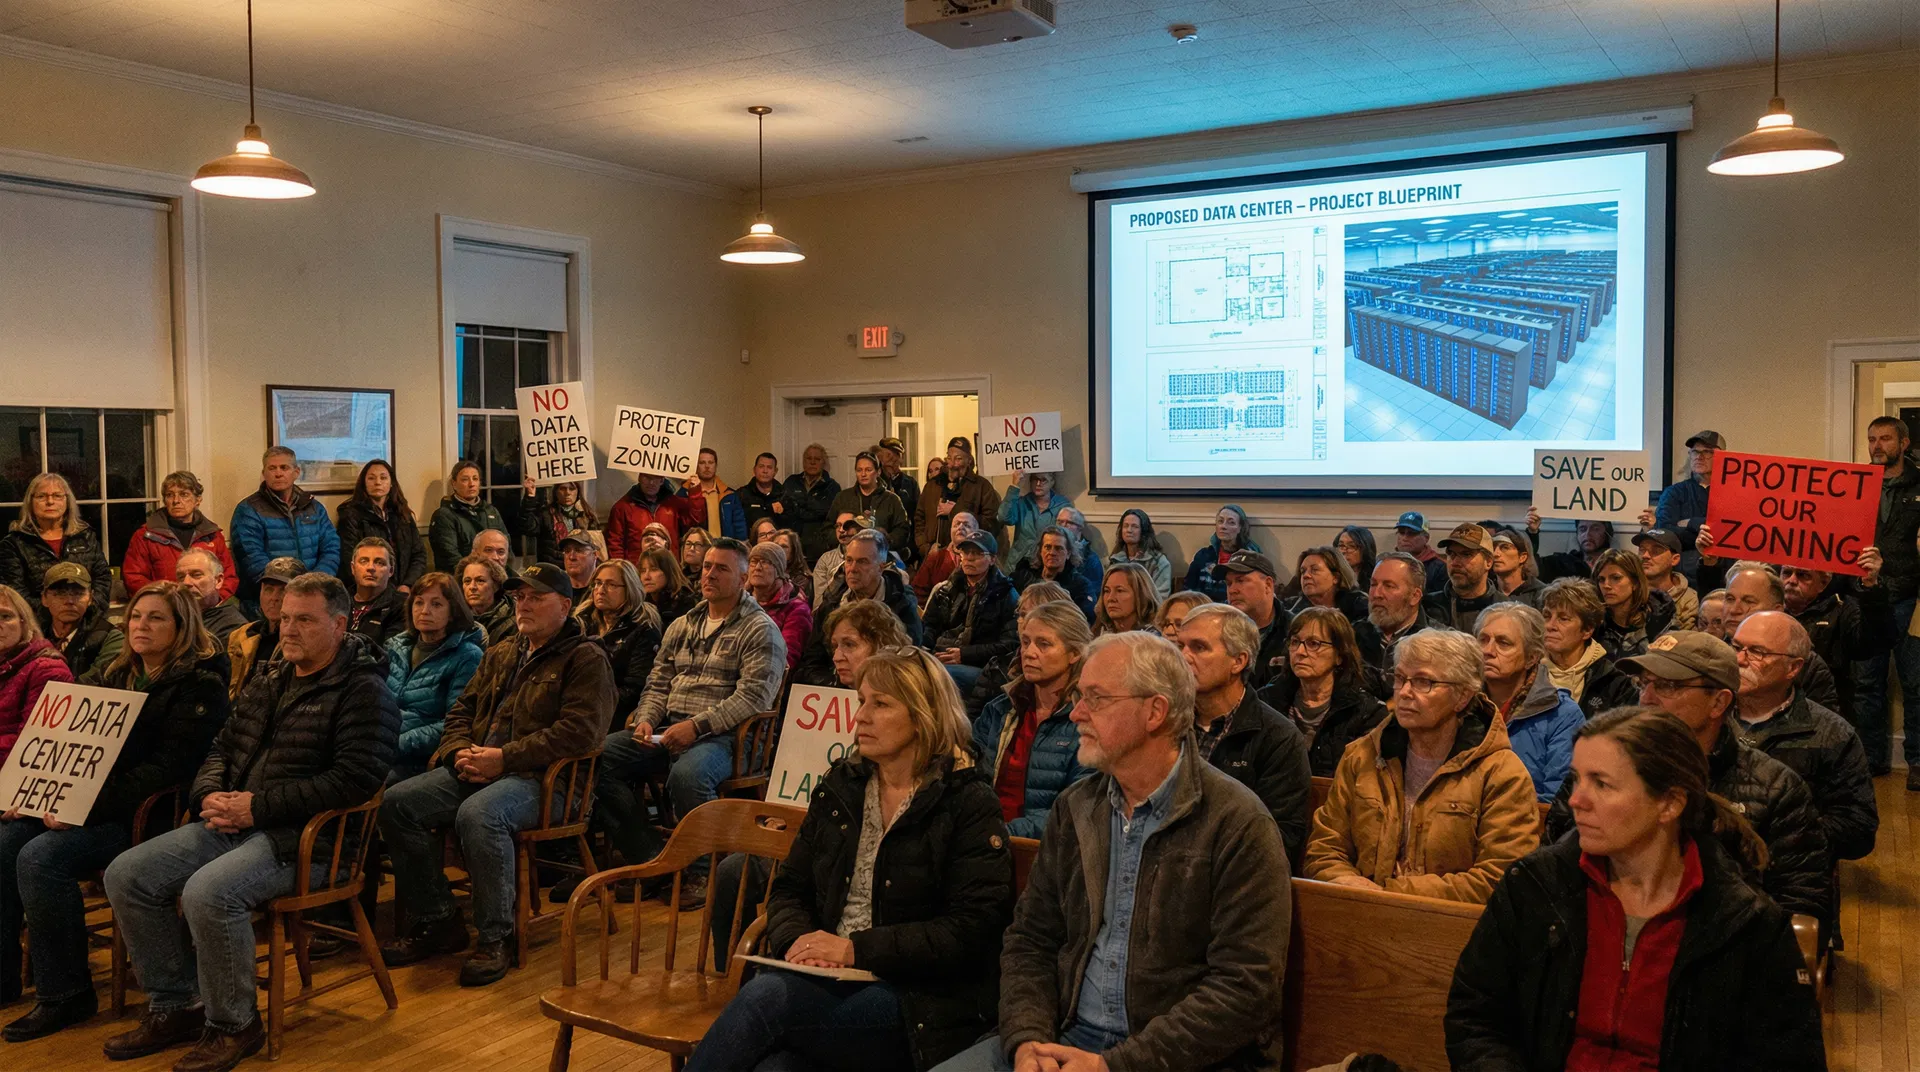
When communities organize, they can stop even the biggest tech companies.
State-by-State Approval Landscape
"Are Wisconsin and Utah outliers that will eventually conform — or the leading edge of a regulatory shift that other states will follow?"
Land Use Is the Real Battleground
Among the 35 rejection and moratorium records, land use and zoning is the #1 reason for project rejection. Energy consumption and water usage — the issues that dominate media coverage — are notably not the top reasons.
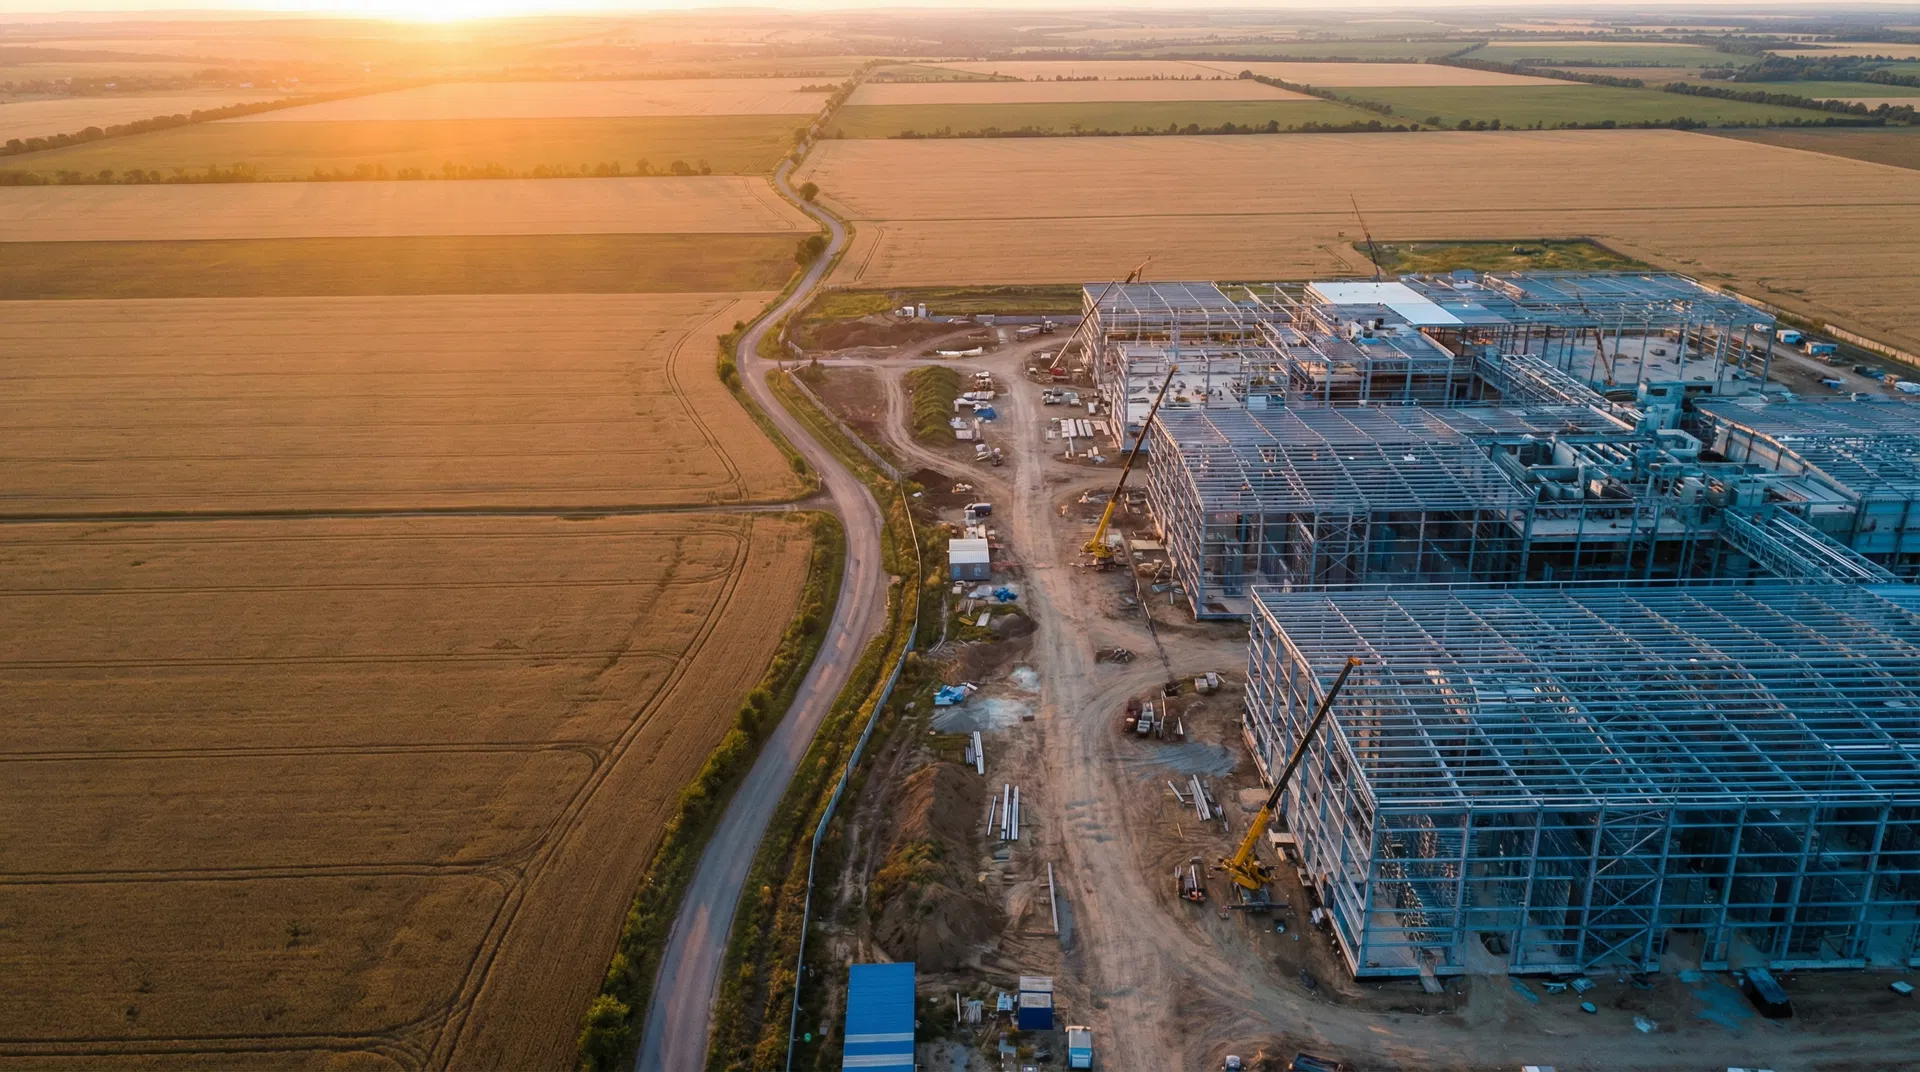
The public debate is framed around energy and carbon emissions. But the people who actually show up to planning commission meetings are worried about their property values, their commute, and whether 244 acres of corn fields will become a windowless concrete box. The most effective opposition isn't about saving the planet — it's about saving the neighborhood.
Top Reasons for Data Center Rejection
"If the real opposition is about land use rather than energy, does the industry's strategy of promising 'clean energy' completely miss the point of why communities are saying no?"
The Exponential Cancellation Curve
Data center cancellations due to local opposition have grown from 2 (2023) to 6 (2024) to 25 (2025) — a trajectory that, if continued, would suggest 75-100+ cancellations in 2026.
Both sides can claim victory with the same data. Opponents point to a 4x increase year-over-year. Proponents point out that 98%+ of projects still proceed. The critical question: does this follow an S-curve that plateaus, or a true exponential that accelerates?
Data Center Cancellations Due to Local Opposition
Shaded area shows projected 2026 range based on current trajectory.
"Is the cancellation trend a nuisance for the industry or the beginning of a political movement that could reshape where — and whether — AI infrastructure gets built in America?"
The Data Doesn't Lie — But It Does Surprise
The story of data center development in America isn't what the headlines suggest. It's not a story of growing opposition stopping Big Tech. It's a story of an approval machine running at 94% efficiency, a quiet Midwest revolution, and a regulatory process that favors those with the deepest pockets.
The question isn't whether data centers will be built. It's whether anyone is truly in control of where, how, and at what cost.
Data sourced from Spark Data Center Intelligence (March 2026), Heatmap Pro, CNBC, Indiana Capital Chronicle, Reason Magazine, Fortune, and public regulatory filings. All figures are approximate and based on publicly available data.