
The Regulatory Reckoning
5 non-obvious insights from 425,000 US data center permitting records. The data contradicts almost everything the industry believes about regulatory risk.
The 2026 Moratorium Rate Has Already Exceeded All of 2025 — in 3 Months
The headline numbers make 2025 look like the inflection year — 100 moratoriums filed, up from 3 in 2024. But 2026 YTD (Q1 only) has already recorded 101 moratoriums, matching the entire 2025 total with nine months still remaining.
The opposition rate has climbed from 20.7% in 2025 to 26.5% in 2026 YTD — more than 1 in 4 regulatory records now carries an opposition signal.
Critically, total DC records appear to be declining from the 2025 peak, but opposition is not declining proportionally. Any model that treats 2025 as the high-water mark for regulatory risk is already wrong.
DC Records vs. Opposition Rate by Year
Bar width represents record volume. Opposition rate (%) shown right. M = moratorium count.
The Hyperscaler Approval Rate Is a Mirage — the Real Risk Is Pending, Not Denied
In states with active moratoriums, pending filings can stall indefinitely — making the decision window the real risk, not the denial.
Meta shows a 2.8% approval rate. Google: 2.6%. Amazon: 3.3%. Microsoft: 4.3%. These numbers look alarming — until you understand what they actually represent: not rejections, but unresolved filings.
Google and Microsoft have zero denials across 495 and 375 records respectively. The actual risk is not denial — it is indefinite stall. The 400 records currently in pending status represent the true capital exposure.
The question is not "will this project get denied?" but "will this project ever get a decision?" — and in 31 states with active moratoriums, the answer is increasingly uncertain.
Hyperscaler Record Status: Pending vs. Approved vs. Denied
The vast majority of hyperscaler records are pending — not decided. Source: Spark AI Permitting Macro, Mar 2026.
Smaller Operators Are Navigating Permitting 4–5x More Effectively Than Hyperscalers
Beale Infrastructure has a 13.5% approval rate across 156 records. Vantage Data Centers achieves 9.3% across 108 records. Tract reaches 5.1% across 157 records.
Compare this to Meta's 2.8% and Google's 2.6%. Non-hyperscaler operators are getting decisions — and positive ones — at rates 4 to 5 times higher than the companies spending $40B+ per state.
This is not coincidence. Smaller operators file in lower-competition jurisdictions, size projects below the energy and water thresholds that trigger opposition, and engage communities before opposition organizes. The volume-first, site-later strategy that worked for hyperscalers in 2022 is now a structural liability.
Approval Rates: Specialist Operators vs. Hyperscalers
Approval rate = approved records ÷ total records. Source: Spark AI Permitting Macro, Mar 2026.
Indiana Is the Most Dangerous State in the Country for Data Center Investment — and the Data Is Being Ignored
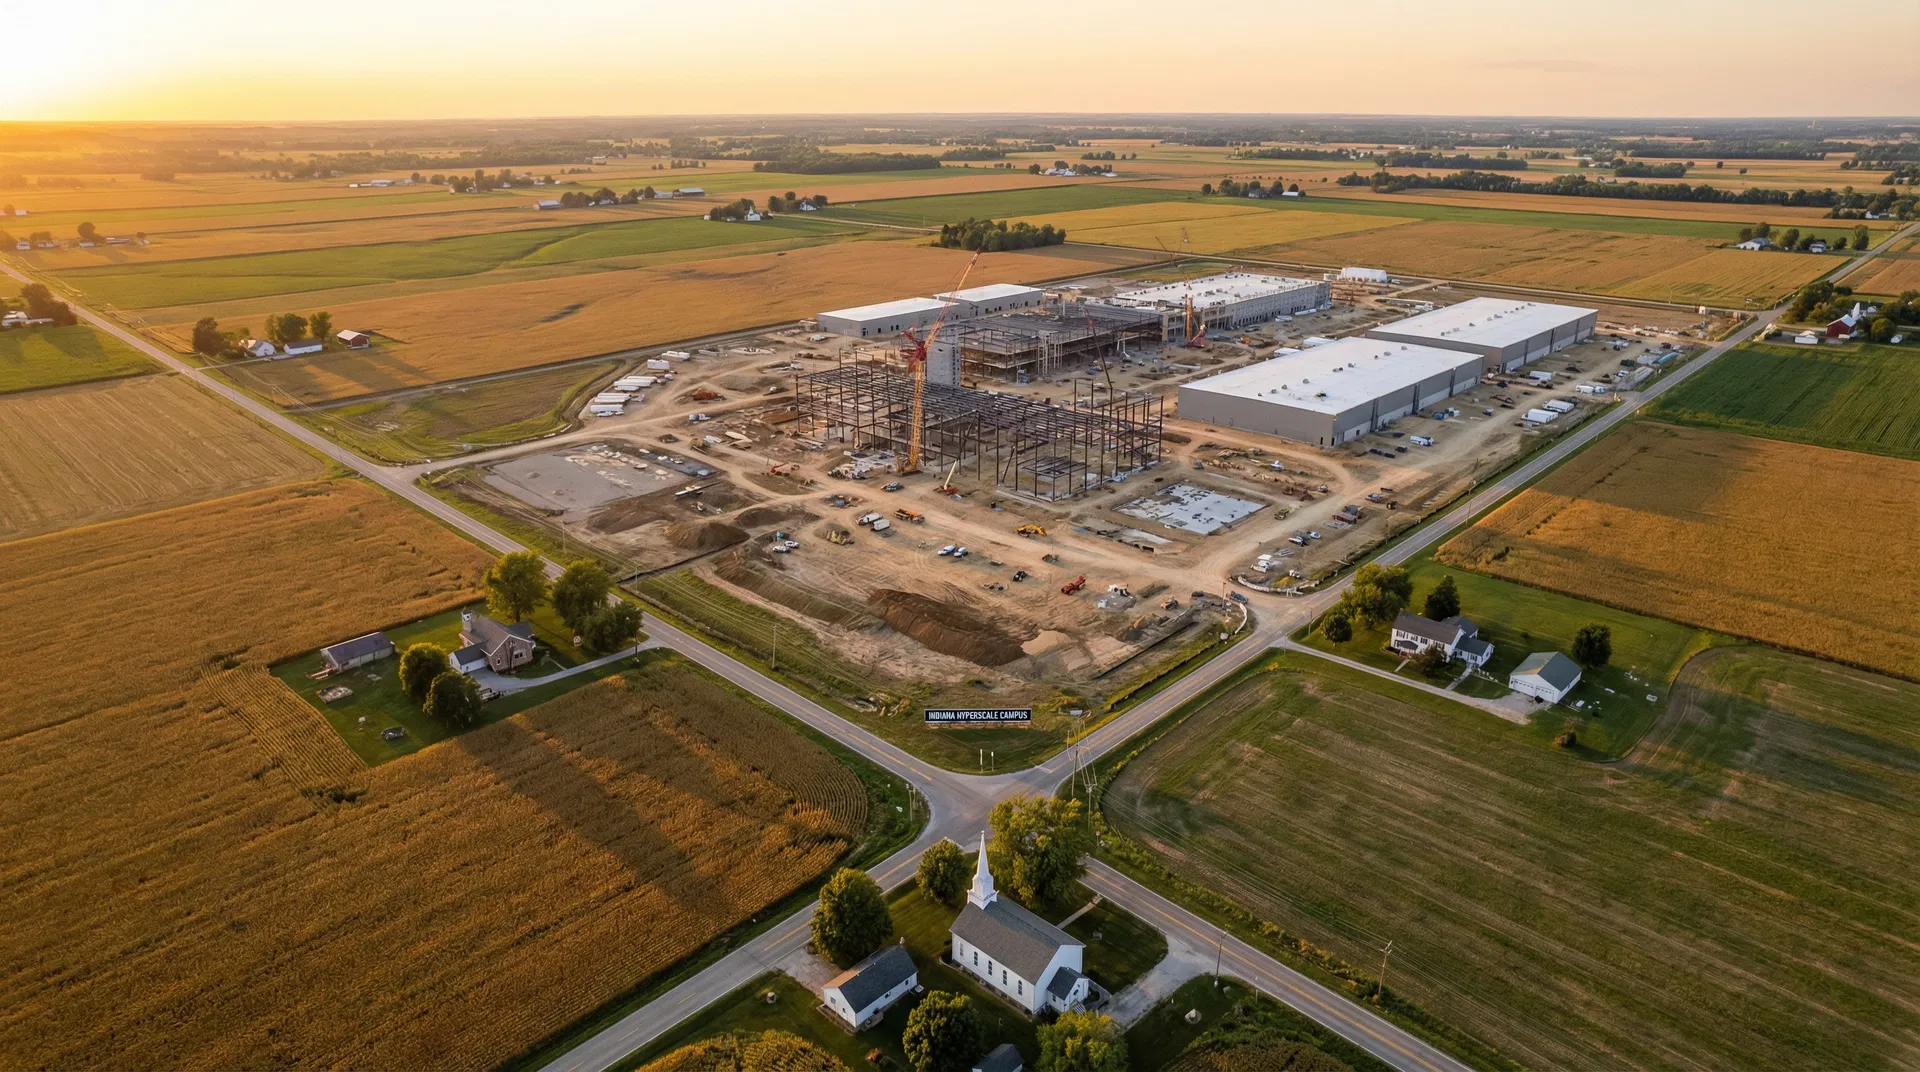
Indiana: 319 records, ~38 moratoriums, HIGH risk classification — yet home to Meta's $10B Lebanon megacampus.
Indiana has 319 records (the highest of any HIGH-risk state), ~38 moratoriums (the most of any state in the country by a wide margin), and is classified as HIGH risk on the heat map.
Yet Meta's heaviest Midwest footprint is in Indiana, and the $10B Lebanon megacampus is one of the largest single-site announcements in US history. The moratorium count is not a lagging indicator — it is active and accelerating, with multiple county-level freezes recorded as recently as February 2026.
The Lebanon approval may have created a false sense of regulatory safety that the broader state-level data does not support. Indiana is the clearest example in the dataset of capital concentration in a jurisdiction where the regulatory environment is actively deteriorating.
Top 10 States by Moratorium Count
Color indicates the state's overall risk classification on the Spark heat map.
Source: Spark AI Moratorium Tracker, Mar 2026. 207 total moratoriums tracked across 31 states.
The Moratorium Contagion Is Following Energy Infrastructure, Not Just Data Centers — and Spreading Into Previously Safe States
The most underappreciated pattern in the data is that the majority of recent moratoriums bundle data centers together with solar farms, battery storage, and carbon capture in a single regulatory freeze.
Dearborn County, Indiana froze both solar farms and data centers simultaneously. Austin County, Texas is considering a moratorium on battery storage, data centers, and carbon capture together. Denver, Colorado proposed a moratorium specifically to review energy and water use.
The opposition is not to data centers per se — it is to energy infrastructure at scale. Any site that co-locates with or sits adjacent to renewable energy projects is inheriting that opposition.
Moratoriums have now appeared in 31 states, including first-time signals in Texas, Minnesota, and Oklahoma — previously considered safe corridors.
New States Entering the Moratorium Conversation (2026)
Austin County considering moratorium on battery storage, data centers & carbon capture
Statewide push for moratorium on hyperscale data centers — unprecedented scope
Debating AI data centers, utility cost protections, and potential moratorium
Source: Spark AI Moratorium Tracker, Feb–Mar 2026.
The Through-Line: A Structural Shift, Not a Cyclical One
Filing volume is normalizing. But resistance is compounding. The 2026 data makes clear that the regulatory environment has undergone a structural shift — not a temporary spike that will revert to the mean.
The operators best positioned to survive are those who treat regulatory intelligence as a primary input to site selection — not a post-hoc compliance exercise. The window between first public signal and moratorium is compressing. The geographic spread of opposition is accelerating.
The data from Spark AI's 425,000+ records tells a story the industry is not yet pricing in: the era of frictionless data center development in the United States is over.